
Our impact
Measuring what matters.
We report clearly defined, year-specific outcomes. Every number below says what was counted and where it comes from.
Confirm current percentage.
Confirm current 24/7 status.
Season report
2021–2023 season at a glance
From emergency needs to a long-term response: who came through the doors, what they received, and where they went next.
Who we served
- 110
- guests served
- 10
- families
- 27
- children
- 2
- expectant mothers
- 57
- women
- 62
- men
Immediate response
- 24
- weeks of shelter
- 1,440
- meals served
- 309
- loads of laundry
- 589
- showers
Housing outcomes
- 27
- found housing
- 8
- moved to another shelter
- 11
- moved in with family
- 6
- moved in with friends
- 24
- emergency housing vouchers
- 12
- CERA vouchers
- 12
- MSHDA vouchers
- 7
- rapid rehousing placements
Benefits & employment
- 3
- new Social Security benefits
- 8
- new Medicaid enrollments
- 10
- new jobs
How it gets done
- 23
- host churches
- 15
- community & business partners
- 3,084
- volunteer hours
- 7
- grants
- 13
- staff members
- 135
- donors
Source: ICRH 2021–2023 impact report graphic, published on icrhouse.org.
Confirm season dates and definitions with ICRH before launch.
The response
The rotating season is over.
For years ICRH guests moved every week: days at the day shelter, nights at whichever church was hosting. With the Morey House, guests stay put and have their own bed.
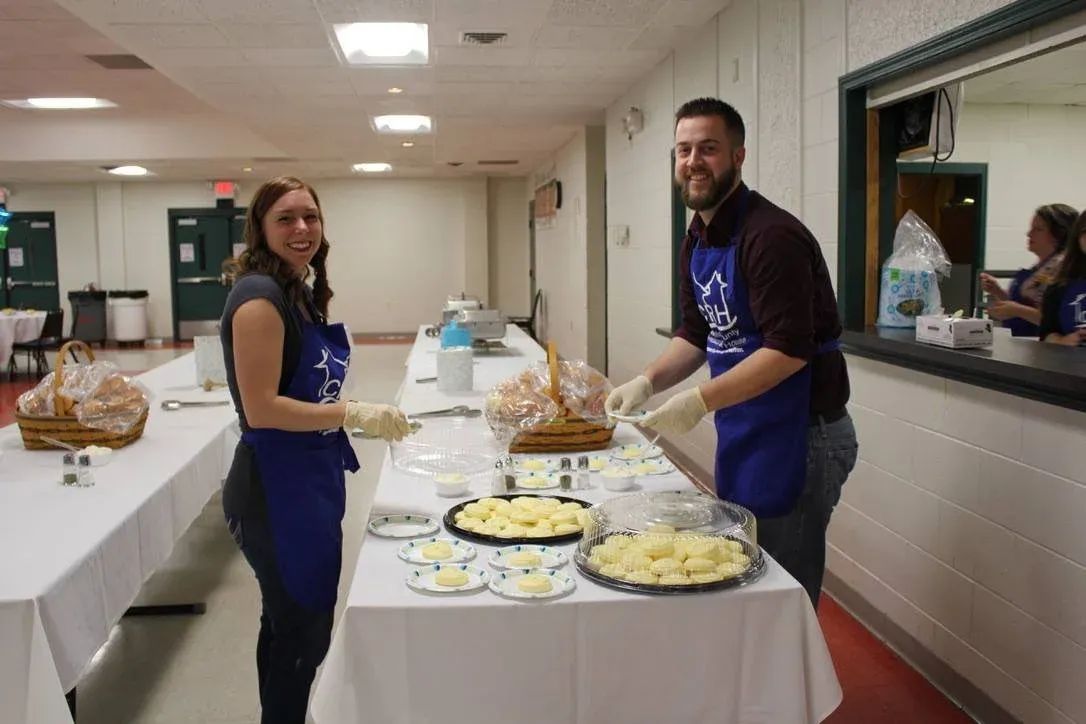
Local churches and partners now focus on what they do best: bringing the evening meal, visiting with guests and helping staff. Volunteers are still needed every day and evening.
The need
Largely invisible, and very real.
These figures appear on the current website without a source or year. Publish only after ICRH confirms the source, year and definition.
This section is hidden automatically when review mode is turned off, until sources are added.
Reports
Annual reports and financials
Annual reports, Form 990s and financial statements are listed on the Transparency page.